Welcome to my page! I am a master's student at UC San Diego. These are some of my projects that are primarily focused on Machine Learning and Data Visualization but also encompass a broader spectrum of Computer Science. When I'm not knee-deep in Python code, I'm probably watching a cheesy horror flick or scrolling endlessly on Twitter.
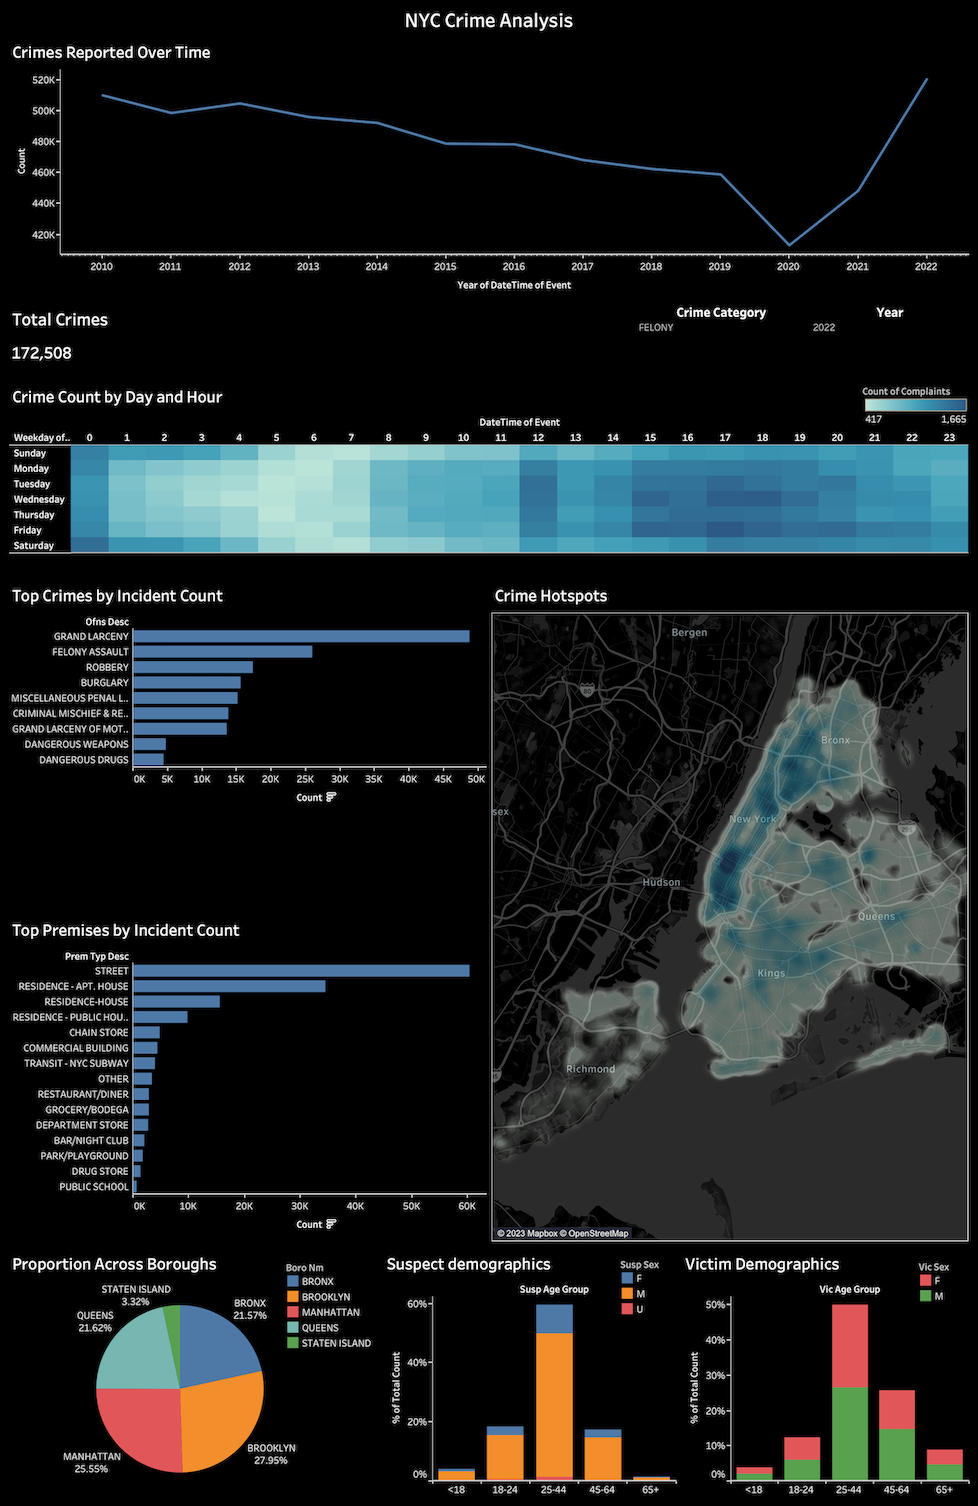
Using dataset from NYC open data - this tableau dashboard illustrates the temporal and geographical patterns of criminal activity, highlighting key periods/places of incidents.
Getting a sense of the patterns and trends of the 1.1 Million students from 219 countries. Aspiring to achieve the "American dream".
An animated world map showing the search interest for a keyword over 2 years, created in R using ggplot and gganimate.
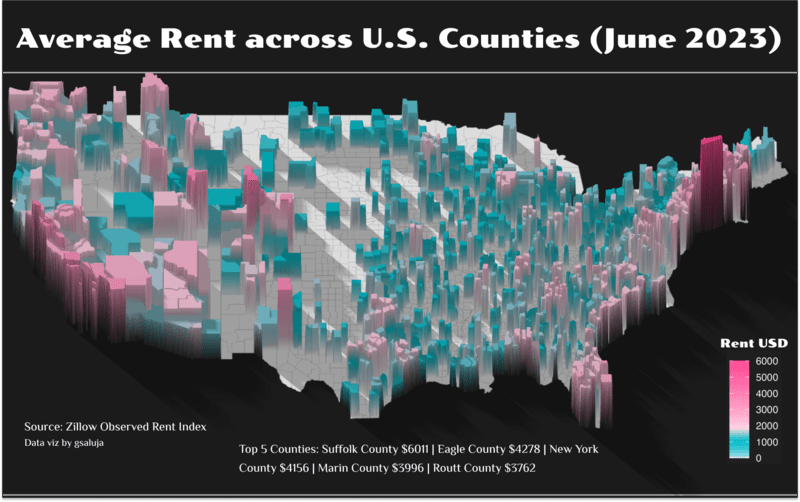
A 3D map showing the average rent across 1,110 U.S. counties. Created in R using the rayshader package.
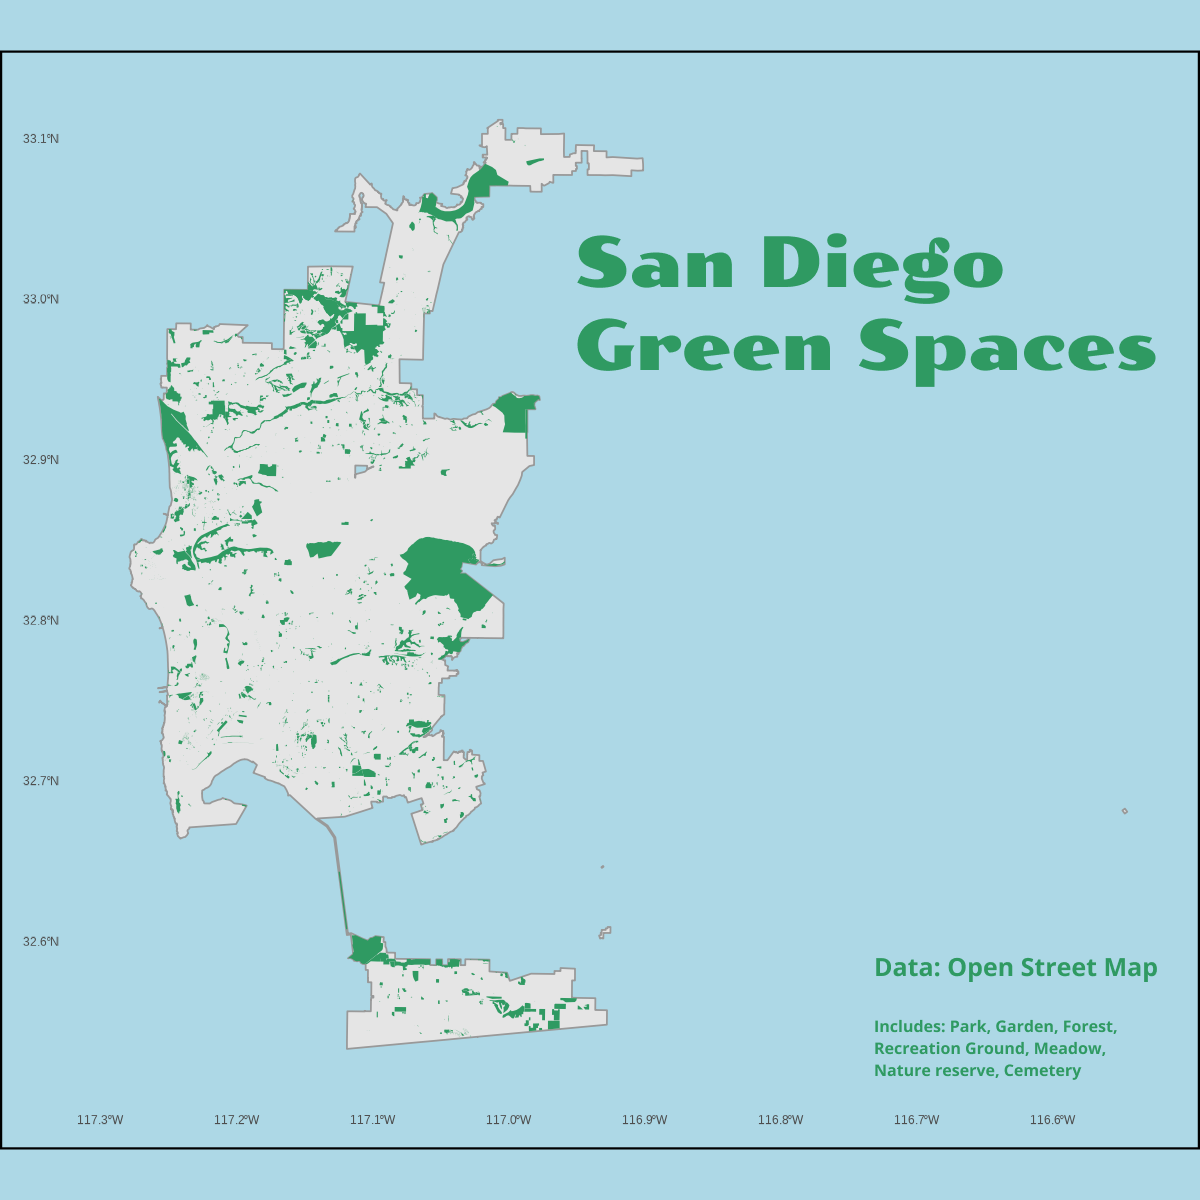
Visualizing San Diego's Greenery: A map crafted from OpenStreetMap data in R, highlighting the city's parks, nature reserves, forests, gardens, and meadows.
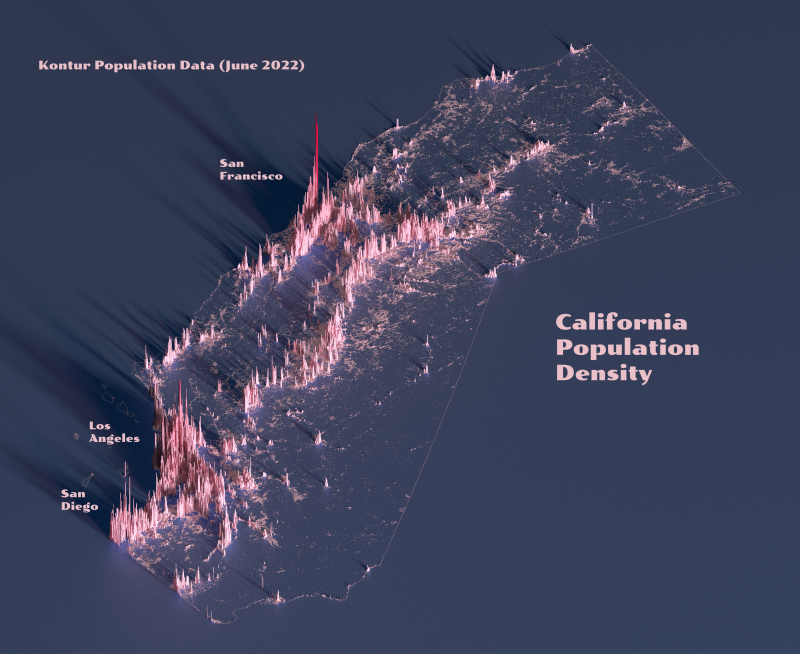
A 3D population density map of California created in R with the rayshader package (credits - tutorial by Spencer Schien).
Email - gsaluja@ucsd.edu


